Measuring the Business Impact of Community Events: A Framework for 2026
Community leaders know that events drive business outcomes. The problem is that most of them cannot prove it in a language their CFO, CMO, or VP of Customer Success will act on.
The CMX Community Industry Report, published by Bevy's CMX community, has consistently found that proving business value and ROI to leadership is the top challenge cited by community professionals. Events are among the most expensive line items in a community budget. They require staff time, travel costs, venue fees, speaker coordination, and weeks of operational preparation. And when budget review season arrives, community leaders are often left presenting attendance counts and post-event survey scores while the rest of the business talks about retention rates, expansion revenue, and pipeline.
That gap between what events actually deliver and what community teams can demonstrate is not a data problem. It is a measurement design problem. Most community event programs measure the inputs and outputs that are easiest to track, rather than the outcomes that connect to business goals. Attendance numbers tell you how many people showed up. They do not tell you whether those people renewed, expanded their contracts, referred new customers, or became advocates who influenced pipeline.
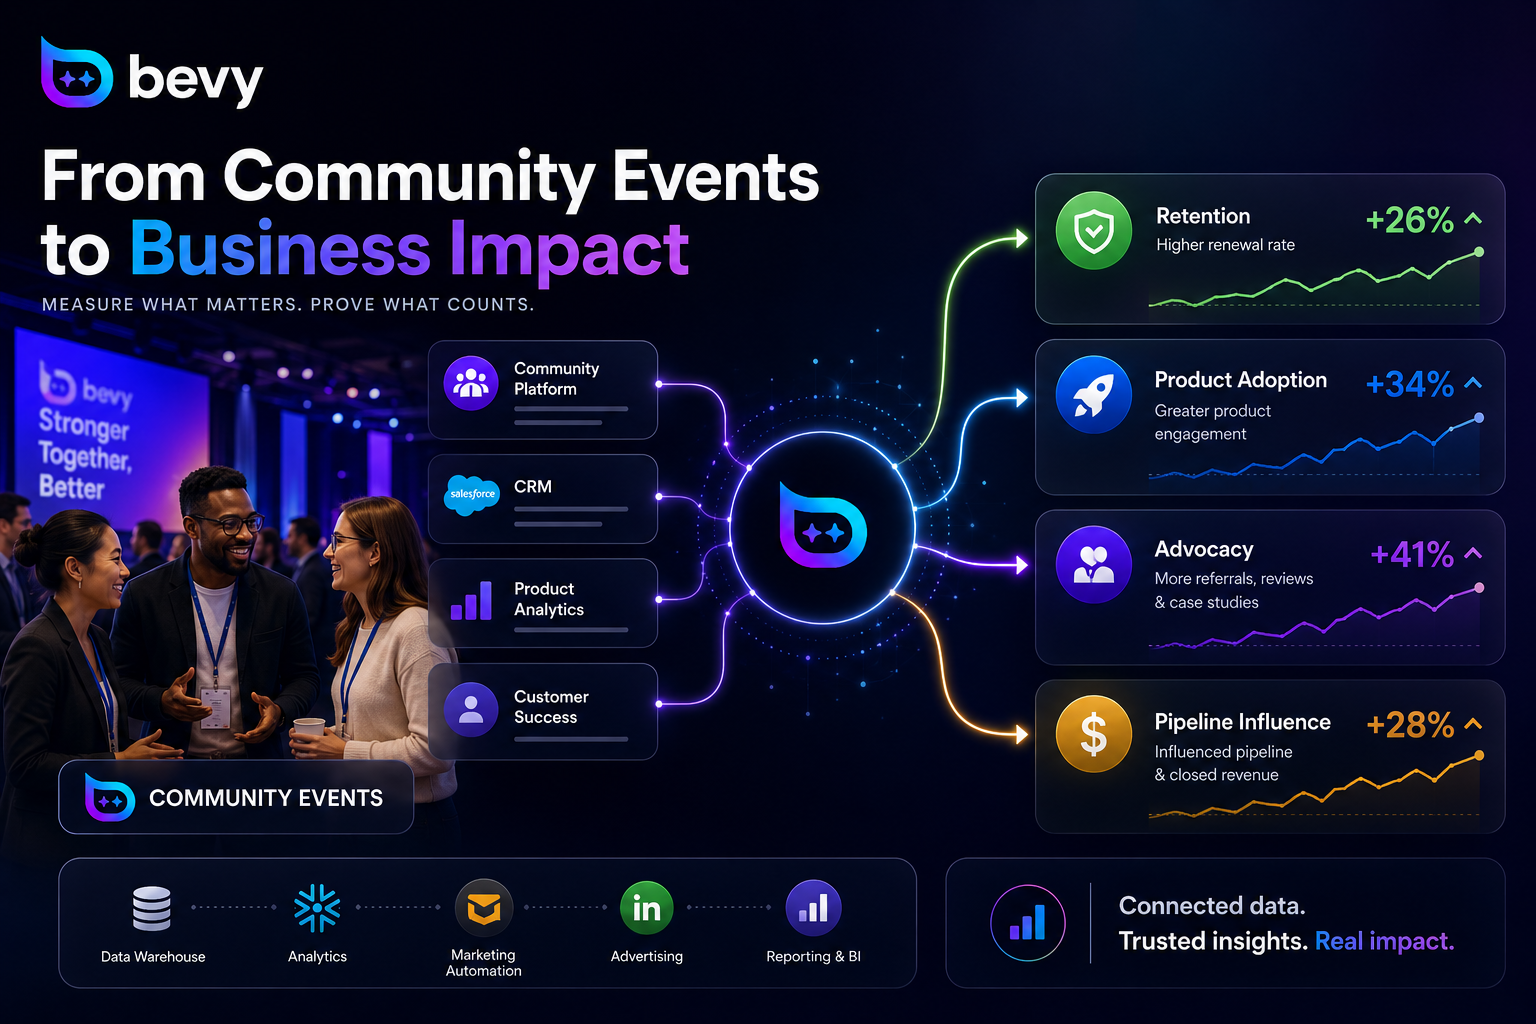
This post provides a framework for measuring the business impact of community events in a way that connects to the metrics your leadership already uses. It is organized around four outcome categories: retention, product adoption, advocacy, and pipeline influence. For each category, it explains what to measure, how to structure the measurement, and what data infrastructure you need to make it work.
Direct answer: Measuring the ROI of community events requires tracking four categories of business impact: retention (do event-attending members renew at higher rates), product adoption (do attendees engage more deeply with the product after events), advocacy (do attendees refer others, participate in case studies, or generate reviews), and pipeline influence (do event attendees appear in open or closed sales opportunities). The measurement model starts with tagging event attendees in your CRM and community platform, then comparing their behavior and business outcomes to non-attendees over a defined time period. The key is connecting community event data to existing business systems rather than measuring events in isolation.
Why Event Measurement Fails in Most Programs
Before presenting the framework, it is worth naming why most community event measurement falls short. The failure patterns tend to cluster around three problems.
The first is measuring activity instead of outcomes. Event attendance rate, registration-to-attendance ratio, and post-event survey scores are all useful operational metrics. They tell you whether your event logistics worked. They do not tell you whether the event created business value. A community event with 300 attendees and a 4.6 out of 5 satisfaction score that produces no measurable change in retention, product engagement, or advocacy is not a successful business investment. It is a successful logistics operation.
The second problem is measuring events in isolation. Community event data is typically stored in the event platform. Customer retention data is in the CRM. Product adoption data is in the product analytics system. NPS scores are in the customer success platform. When these systems do not talk to each other, and when community teams do not have a process for connecting event attendance data to customer records, it becomes impossible to answer the question that matters most: what happened to the business outcomes for customers who attended our event, compared to those who did not?
The third problem is the wrong time horizon. Many community event programs measure outcomes in the days or weeks after an event, when the effects of event participation are still unfolding. Retention impact from a community event often does not appear in renewal data for six to twelve months. Advocacy impact compounds over quarters and years. Measuring community event ROI on a 30-day horizon is like measuring the ROI of a sales hire in their first month. The time frame is too short for the underlying value to surface.
A measurement framework that works needs to solve all three problems: it must track outcomes instead of activity, it must connect event data to business systems, and it must use a time horizon that allows real business impact to become visible.
Category One: Retention
Retention is the business outcome most directly and consistently connected to community event participation. Forrester research on B2B customer engagement programs indicates that customers who attend community or vendor-hosted events retain at materially higher rates than customers who engage only through digital channels. McKinsey analysis has found that companies with structured event programs report significantly higher net revenue retention than comparable companies without them. The relationship between event participation and retention appears to be robust across industries and company sizes.
The measurement approach for retention impact is straightforward in design, though it requires data integration to execute well.
Start by tagging every event attendee in your CRM as soon as attendance is confirmed. The tag should include the event name, date, type (in-person, virtual, hybrid), and location or chapter. This creates a persistent record in the customer data that will follow the account through the renewal cycle.
At the 6-month and 12-month marks after each event, run a comparison between two cohorts: customers who attended the event and customers who did not, matched for account size, contract value, time as a customer, and other relevant variables. The metric you are tracking is renewal rate: what percentage of event attendees renewed their contracts, compared to what percentage of non-attendees renewed.
If event attendance is driving retention impact, you will see a measurable difference in renewal rates between the two cohorts. The size of that difference is your retention lift attributable to event participation. Over time, as you accumulate this data across multiple events, you can calculate an average retention lift per event and use it to build a business case for your event program budget.
Two additional metrics strengthen the retention picture. The first is time-to-churn: are customers who attended events churning at different points in the customer lifecycle compared to those who did not? If event attendees consistently stay through their third or fourth renewal while non-attendees are more likely to churn at the first or second, the event's contribution to long-term customer value becomes clearer. The second is save rate: when a customer is flagged as at-risk by customer success, are event-attending customers more likely to be saved? Community event participation can be a relevant variable in understanding which customers have a deeper relationship with the community and with the company.
Category Two: Product Adoption
The relationship between community events and product adoption is less intuitive than retention but well-supported by the data. Forrester research indicates that customers who attend community events are meaningfully more likely to expand their product usage in the months following attendance than non-attending customers. The mechanism is practical: events expose customers to product capabilities they may not have known about, connect them with peers who share effective usage patterns, and create a sense of investment in getting more value from the product.
Measuring product adoption impact requires connecting event attendance records to product analytics data, which adds a layer of data integration complexity. But the measurement approach is logical.
Identify the specific product behaviors that indicate adoption depth in your product. These will vary by product category, but common indicators include frequency of login, breadth of features used, number of users added to an account, volume of data processed or actions taken, and completion of key workflow milestones. Define what "high adoption" looks like relative to your product's usage model.
After each event, track the product usage behavior of attendees in the 30, 60, and 90 days following the event. Compare their usage trajectory to a matched cohort of non-attendees over the same period. Look for changes in usage frequency, feature breadth, or adoption milestones. If event attendance is influencing product adoption, you will see the attendee cohort trending higher than the non-attendee cohort within 60 to 90 days of the event.
A useful supplementary metric is the correlation between event type and adoption outcome. Hands-on workshops and product-focused sessions tend to drive the strongest near-term adoption lift because they directly expose customers to product capabilities. Networking-focused events may show less immediate product adoption impact but stronger retention and advocacy impact over a longer time horizon. Understanding which event types drive which outcomes helps you design a balanced event calendar that moves multiple business metrics rather than optimizing for a single outcome.
Category Three: Advocacy
Advocacy is the outcome most frequently cited by experienced community practitioners as the strongest differentiator of event-led community programs. Jono Bacon, author of "People Powered," has written from his consulting experience with enterprise clients that community programs with active event and user group components produce customer advocates at rates materially higher than programs operating primarily through digital channels alone. David Spinks, founder of CMX and a Bevy advisor, has noted from his practitioner experience that user group attendees become brand advocates far more frequently than members who participate only in online forums.
Advocacy manifests in several forms that can each be tracked: customer referrals, product reviews on third-party review platforms, participation in case studies, speaking appearances at industry events, and engagement in analyst reference calls. Most of these can be linked to community event attendance with some intentional tracking.
The measurement approach for advocacy starts with tagging event attendees and then tracking their subsequent advocacy activity in a shared record. Build a simple tracker that logs: which customers have been referred by community members, which customers have submitted reviews, which customers have agreed to be case study subjects, and which customers have spoken at industry events or participated in customer advisory programs. Tag each of these records with whether the customer attended a community event in the twelve months prior to the advocacy action.
Over time, this creates a dataset that allows you to calculate the advocacy conversion rate among event attendees versus non-attendees: what percentage of customers who attended at least one event in the past twelve months have taken at least one advocacy action, compared to the percentage among customers who have not attended events. If the event-to-advocacy relationship is as strong as the practitioner evidence suggests, the difference in advocacy conversion rates will be material.
A second useful advocacy metric is the time from event attendance to first advocacy action. If customers who attend events tend to take their first advocacy action within six to nine months while non-attending customers rarely take advocacy actions at all, the event's role in activating advocacy becomes a defensible part of the business case.
MIT Sloan Management Review research on community social capital found that in-person event attendance significantly increased subsequent online community participation. This is a related measurement worth tracking: post-event contribution rate. Do event attendees become more active content contributors, discussion participants, and peer helpers in the online community after attending an event? Tracking the community engagement behavior of event attendees before and after event attendance gives you a measurable proxy for the relationship between events and community health that requires no CRM integration to execute.
Category Four: Pipeline Influence
Influenced pipeline is the metric that tends to resonate most directly with marketing and sales leadership because it speaks their language. It answers the question: how many deals in our pipeline, and what dollar value of revenue, involved at least one contact who attended a community event?
Influenced pipeline does not mean that the event directly caused the deal. It means the event was a touchpoint in the customer journey of at least one contact who was later involved in a sales opportunity. This is a standard attribution model that most marketing organizations already use for other programs. Applying it to community events connects the community program to the pipeline conversation.
The measurement approach requires that event attendees are tagged in the CRM with a community event touchpoint, and that your CRM has the ability to surface deals where a contact has that tag. Many CRMs support this natively or through marketing automation integration. If your CRM does not currently track community event attendance, this is the integration investment that unlocks the broadest set of business outcome metrics across all four categories, not just pipeline influence.
Once the tagging is in place, run a monthly or quarterly report on influenced pipeline: open and closed deals where at least one contact attended a community event. Report on the number of influenced opportunities, the total pipeline value, and the win rate of influenced opportunities compared to non-influenced opportunities. Win rate is a particularly useful metric because it moves the conversation from attribution (the event was a touchpoint) to causality (opportunities with community event touchpoints close at a higher rate), which is a stronger business case.
A related pipeline metric is sales cycle length. If influenced opportunities close faster on average than non-influenced opportunities, the community event program is contributing to sales velocity. This matters to sales leadership because it means deals with community-engaged contacts require less sales effort to close, which has operational efficiency value alongside the pipeline value.
IDC analysis of customer experience programs predicts that leading enterprise organizations will increasingly treat community events and human touchpoints as integral parts of their pipeline and retention models rather than as separate community metrics. For community leaders, getting ahead of this shift means building the data infrastructure now to demonstrate that your event program is already doing exactly that.
Building the Data Infrastructure
The four-category framework above requires one foundational capability: the ability to tag event attendees in your CRM and connect those tags to the business data systems that track retention, product usage, advocacy, and pipeline. Without that connection, you are measuring events in isolation and the business case will always be limited to operational metrics.
There are three practical steps to build toward this infrastructure.
The first step is to ensure your community event platform exports attendance data in a format that your CRM can import. This is a basic integration requirement. Every event that runs in your community platform should produce an attendee list that can be pushed to the CRM as a contact activity or a custom field update. If your current event management system does not support this, it is a gap worth addressing because it blocks the entire measurement model.
The second step is to define and agree on a consistent tagging convention for community event attendees in the CRM. The tag should include enough information to distinguish event types, dates, and programs so you can analyze impact by event format and community program rather than treating all events as equivalent. A customer who attended three regional user group events in the past year has a different community engagement profile than a customer who attended one virtual product webinar, and your measurement should be able to capture that difference.
The third step is to establish the reporting cadence and the comparison methodology before you start collecting data. Define the matched cohort methodology you will use for retention and adoption comparisons. Decide the time horizons you will use for each metric. Agree on what counts as an advocacy action and who is responsible for logging it. Doing this definitional work before the data starts flowing means your first analysis will be based on consistent, comparable data rather than requiring retroactive cleanup.
The analytic framework is not complex. The data integration work requires some upfront investment. But the output, a clear, recurring report that connects event attendance to retention rates, product adoption trajectories, advocacy conversion, and pipeline influence, is the evidence base that transforms community events from a line item that leadership questions to a program that leadership protects.
For a deeper look at the strategic case for why events drive these outcomes in the AI era, the Week 1 post in this series makes that argument with the supporting research.
Frequently Asked Questions
How do you measure the ROI of community events? Measuring the ROI of community events requires tracking four categories of business impact: retention (do event-attending members renew at higher rates than non-attendees), product adoption (do attendees engage more deeply with the product in the months after events), advocacy (do attendees refer others, write reviews, or participate in case studies), and pipeline influence (do event attendees appear in sales opportunities, and do those opportunities close at higher rates). The model starts with tagging event attendees in your CRM and comparing their business outcomes to a matched cohort of non-attendees over a defined time period. Connecting community event data to existing business systems is the foundational requirement.
What KPIs should you track for community events? Core KPIs for community events include event attendance rate (attendees divided by registrations), retention lift (renewal rate of event attendees versus matched non-attendees at 6 and 12 months), post-event product adoption lift (change in product usage behavior within 30 to 90 days of attending), advocacy conversion rate (percentage of event attendees who take at least one advocacy action within 12 months), post-event community engagement lift (change in forum participation and content contribution after event attendance), influenced pipeline value (total pipeline value from opportunities with at least one community event attendee as a contact), and win rate differential (close rate of influenced opportunities versus non-influenced opportunities). These KPIs connect event participation to business outcomes rather than measuring attendance volume alone.
How do community events impact customer retention? Customers who attend community events consistently show higher retention rates than those who engage only through digital community channels. The mechanism is straightforward: events deepen relationships, create shared identity and belonging, and connect customers to a peer network that increases the perceived cost of leaving the community and the product. Forrester research and McKinsey analysis both indicate materially higher retention rates and net revenue retention for customers and companies with active community event programs. The retention impact typically becomes measurable in renewal data six to twelve months after the event.
How do you connect community event attendance to pipeline? Connecting community events to pipeline requires tagging event attendees in your CRM with a community event touchpoint, then running reports that surface open and closed deals where at least one contact carries that tag. This is an influenced pipeline model: it identifies deals where a community event was a touchpoint in the customer journey without claiming that the event alone caused the deal. Once tagging is in place, you can track influenced pipeline value, win rate for influenced versus non-influenced opportunities, and sales cycle length for influenced deals. These metrics bring the community event program into the same conversation as other marketing and customer success programs that leadership is already tracking.
What tools do you need to measure community event business impact? The foundational requirement is an integration between your community event platform and your CRM, so that event attendee records are automatically or semi-automatically synced to customer contact records as an activity or tag. From there, you need access to product analytics data (to measure adoption lift), renewal and contract data (to measure retention), and pipeline data (to measure influenced opportunities). The data analysis itself can be done in any reporting tool your organization already uses, from a simple spreadsheet comparison to a BI dashboard. The platform integration is the enabling step that most community programs have not yet built.
What is influenced pipeline from community events? Influenced pipeline refers to the total value of sales opportunities where at least one contact involved in the deal attended a community event at some point in their customer journey. It is a touchpoint-based attribution model, not a direct causation claim. Tracking influenced pipeline allows community leaders to demonstrate that event-attending contacts appear in deals at a measurable rate and that those deals close at a comparable or higher rate than deals without community event touchpoints. This connects the community event program to the pipeline reporting that sales and marketing leadership already use.
See How Bevy Supports Community Event Measurement
Bevy's platform combines enterprise event and user group management with an analytics and data layer that supports CRM integrations, event participation reporting, and engagement tracking across your full community program. If you want to see how Bevy helps community teams build the data infrastructure to measure what their events actually deliver, we would like to show you.